Visualize an environment's current state
Source:R/environment.R, R/environment_grid.r, R/environment_network.R
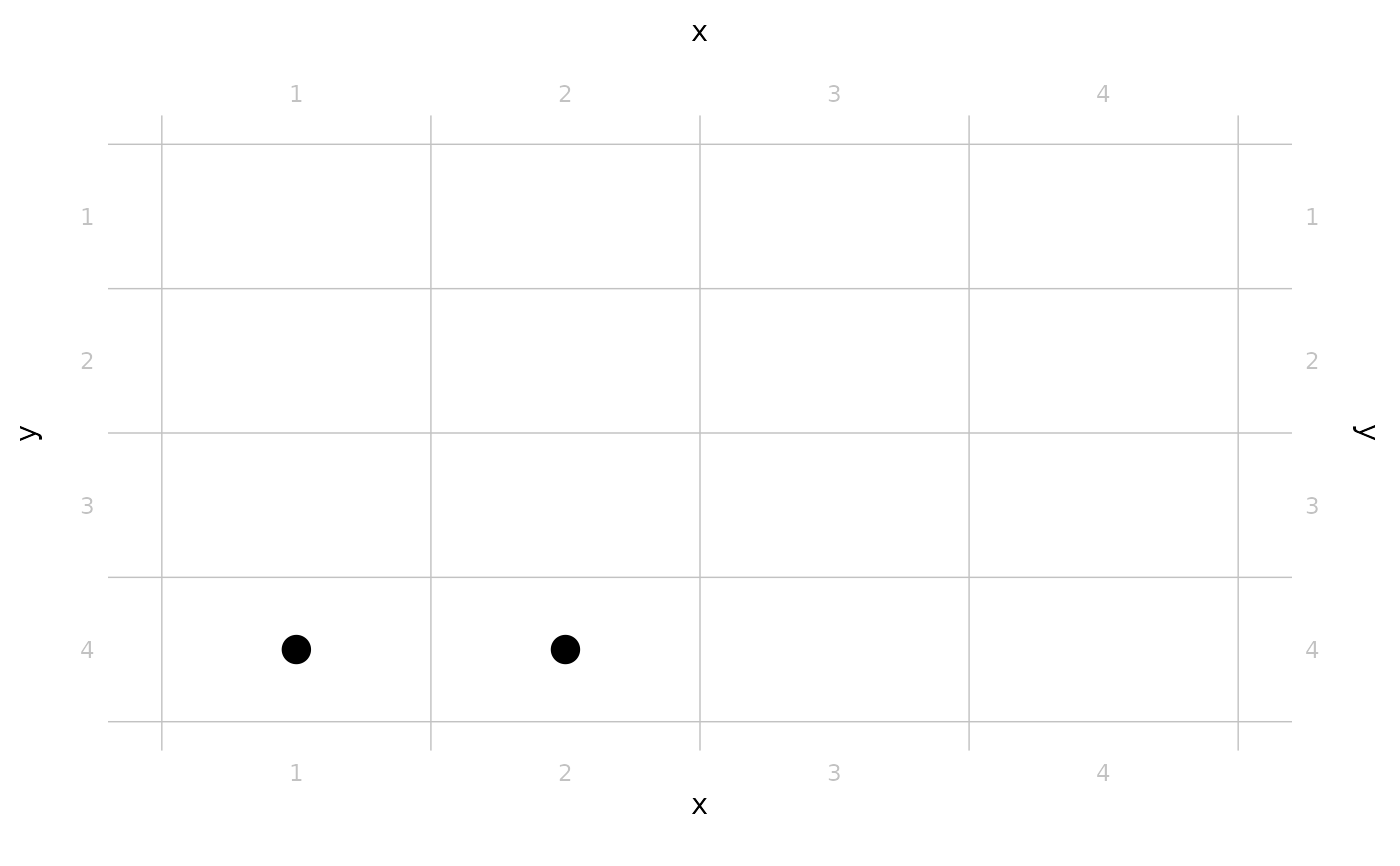
visualize.RdVisualization highly depends on the particular type of environment. For a grid environment, for example, visualization resembles a rectangle with agents placed in it. The function returns a ggplot2::ggplot object, ready to be further visualized/styled/manipulated.
Usage
visualize(.tidyabm, ...)

# S3 method for tidyabm_env_grid
visualize(.tidyabm, color = NULL, shape = NULL, ...)

# S3 method for tidyabm_env_network
visualize(.tidyabm, network_ggraph_layout = "kk", ...)
Arguments
- .tidyabm
the
tidyabm_envobject- ...
other arguments passed to particular types of environment
- color
specify an agent characteristic or variable by name to color agents according to this specific characteristic/variable (default is not to apply any colors)
- shape
specify an agent characteristic or variable by name to shape agents according to this specific characteristic/variable (default is to have all dots)
- network_ggraph_layout
graphical layout to use; see package
ggraphfor details, fittingly/usually this is one of 'kk', 'stress', 'fr', 'lgl', or 'graphopt'
Value
a ggplot2::ggplot object
Examples
create_grid_environment(seed = 4583, size = 4) %>%
  add_agents(create_agent(), 2) %>%
  init() %>%
  tick() %>%
  visualize()
#> [1] "Tick 1 finished in 0.002 secs"